Latest version:5.0.1 build 1126.November 28, 2025.
The Web Serverplugin embeds a fast and lightweight HTTP/HTTPS server inside our data loggers. It does not require 3rd-party web software. The plugin receives parsed data and outputs it to configurable dashboards for multiple remote users. It aggregates data from multiple sources and renders numeric widgets, gauges, charts, lists, and tables with configurable options.
Install this plugin when you need remote access to live or historical logger data without running IIS or Apache. The server listens on a configurable port (default 80 for HTTP and 443 for HTTPS). The plugin generates web pages using predefined templates. Use it for dashboards with live data accessible across a LAN or the Internet.
After creating a page tab (Add page), add widgets (Add widget) to compose a dashboard. Widgets can be rearranged or removed by dragging them to the Drop widget area. To edit, hover over the widget, open the menu via the “…” control, and choose Edit.
Example 1: Single sensor numeric widget with temperature measurements. Configure the “Numeric” widget to show the current value and a horizontal gauge. The dashboard displays the latest value and color codes if thresholds are exceeded.
Example 2: Combined dashboard to aggregate values from three sensors into one page. Add three widgets for different values. For example, “Gauge” for pressure, “Chart” in the middle for temperature history, and “Table” for the last 500 humidity samples.
Incoming serial data example (sample raw line):
2026-01-02 08:00:00, SENSOR01, TEMP, 23.7 2026-01-02 08:00:00, SENSOR02, PRESS, 101.3 2026-01-02 08:00:00, SENSOR03, HUM, 45.2
Parser variables accessible on a dashboard:
DATE_TIME_STAMP = "2026-01-02 08:00:00" SensorId = "SENSOR01" Variable = "TEMP" Value = "23.7"
As a result, the parsed value from the “Value” variable will immediately appear on a dashboard (see the example below).
The Web Server plugin provides a compact web server with template for live and historical data access for our data loggers. It simplifies remote access to dashboards with live received data.
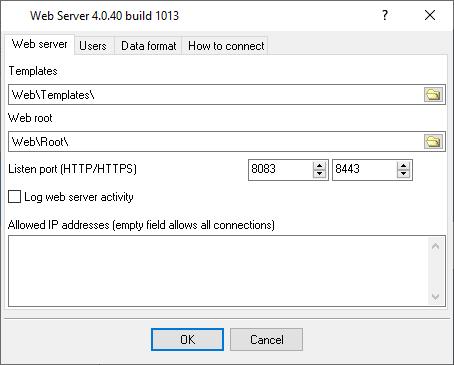
Fig.1. The plugin window.
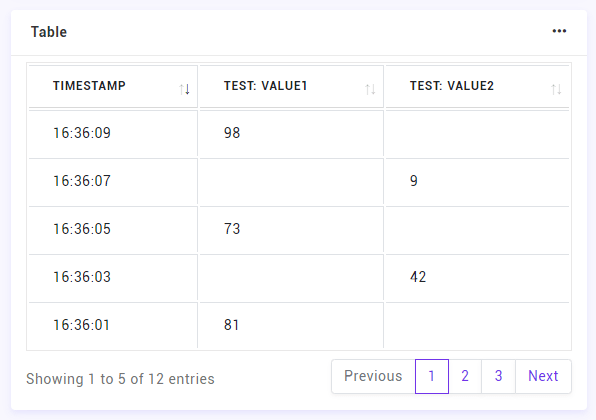
Fig.2. The web page with last values.
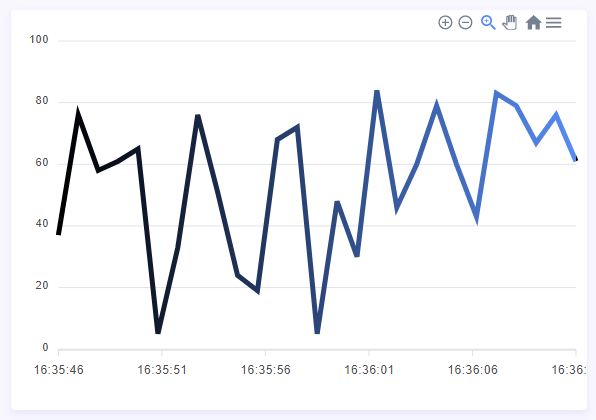
Fig.3. The web page with a chart.
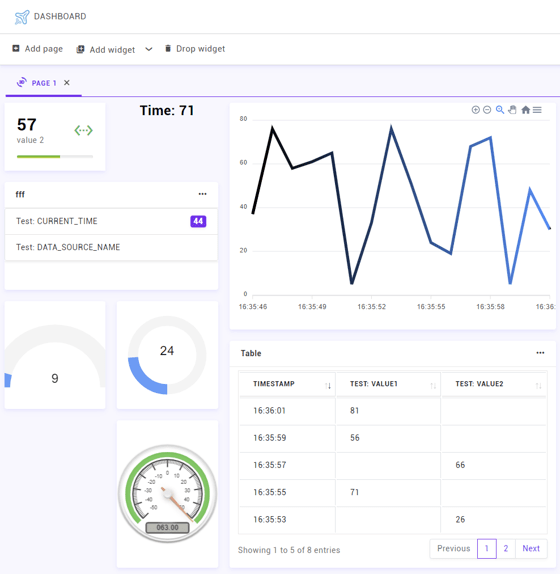
Fig.4. Dashboard example.
All plugins | SQL Database Professional | Cloud Database Professional | ODBC database | Direct Excel/OpenOpffice Calc/LibreOffice Calc Connection | Google Sheets Professional | Excel Export Professional | Send keystrokes | DDE Server | Local (desktop) database | Geo Export | Printer out | Web Server | HTTP POST GET & InfluxDB Export | SFTP Export | MQTT data receiving and publishing | OPC UA Server