Problem scenario:
I want to parse incoming data string into different variables and then have a dashboard with gauges, indicators, charts, etc.
Requirements:
It is assumed that:
You’ve created a configuration using the “Green Plus” button in the main window and configured communication parameters (baud rate, the number of data bits, flow control, etc.) in the data logger and can receive any data without communication errors.
Solution:
You may combine our two software products: Equvera CoNNeX DLS and OPC Scada Viewer. The data logger will receive, process, parse incoming data, and export it using the built-in OPC server. It will allow you to get real-time data in any OPC compatible software. OPC Scada Viewer can visualize data from any OPC DA and DA2 server.
First of all, you need to configure a parser. The parser will parse incoming data string into different variables.
Say, for example, you have configured a parser to extract one floating-point value with the “VALUE1” name.
You need to enable the OPC server plugin on the “Data export” page (fig.1).
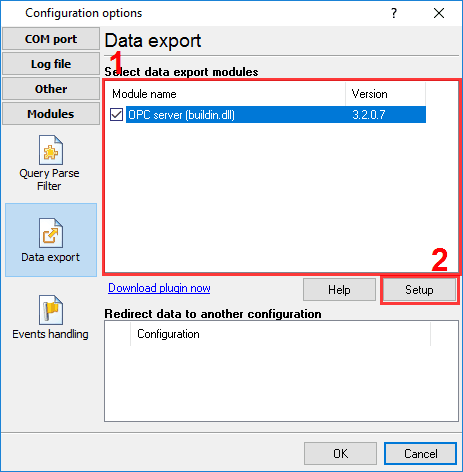
Fig.1. OPC server plugin
Please, open a configuration window of the OPC serverplug-in (click the “Setup” button near a drop-down box fig. 1, pos.2). The dialog window will appear on the desktop (fig. 2).
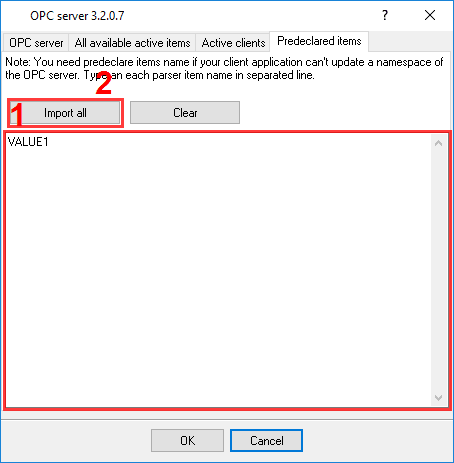
Fig.2. OPC settings
Please, verify that you have configured DCOM as described. Launch the OPC Scada Viewer software (fig. 3).
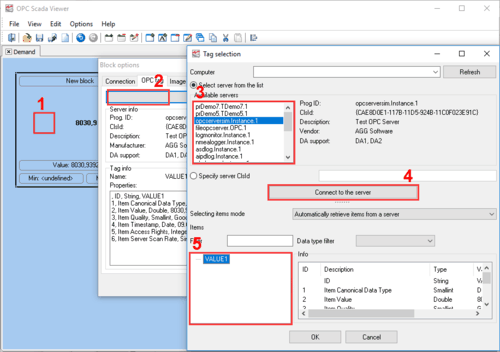
Fig.3. Adding a visualization block
Go to the “Image options” page (fig. 4).
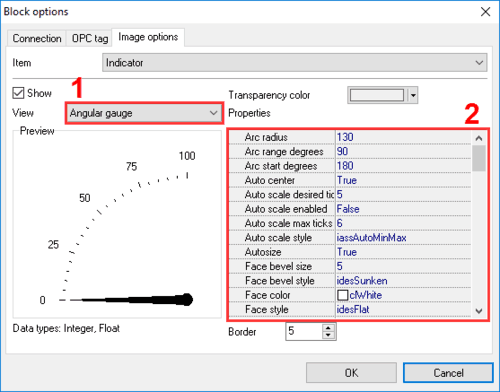
Fig.4. Indicator